Overview
This project is a simulated case study inspired by real-world work I delivered in a client engagement. All proprietary assets have been omitted to preserve client confidentiality, but the architecture and engineering reflect actual problem-solving and implementation strategies.
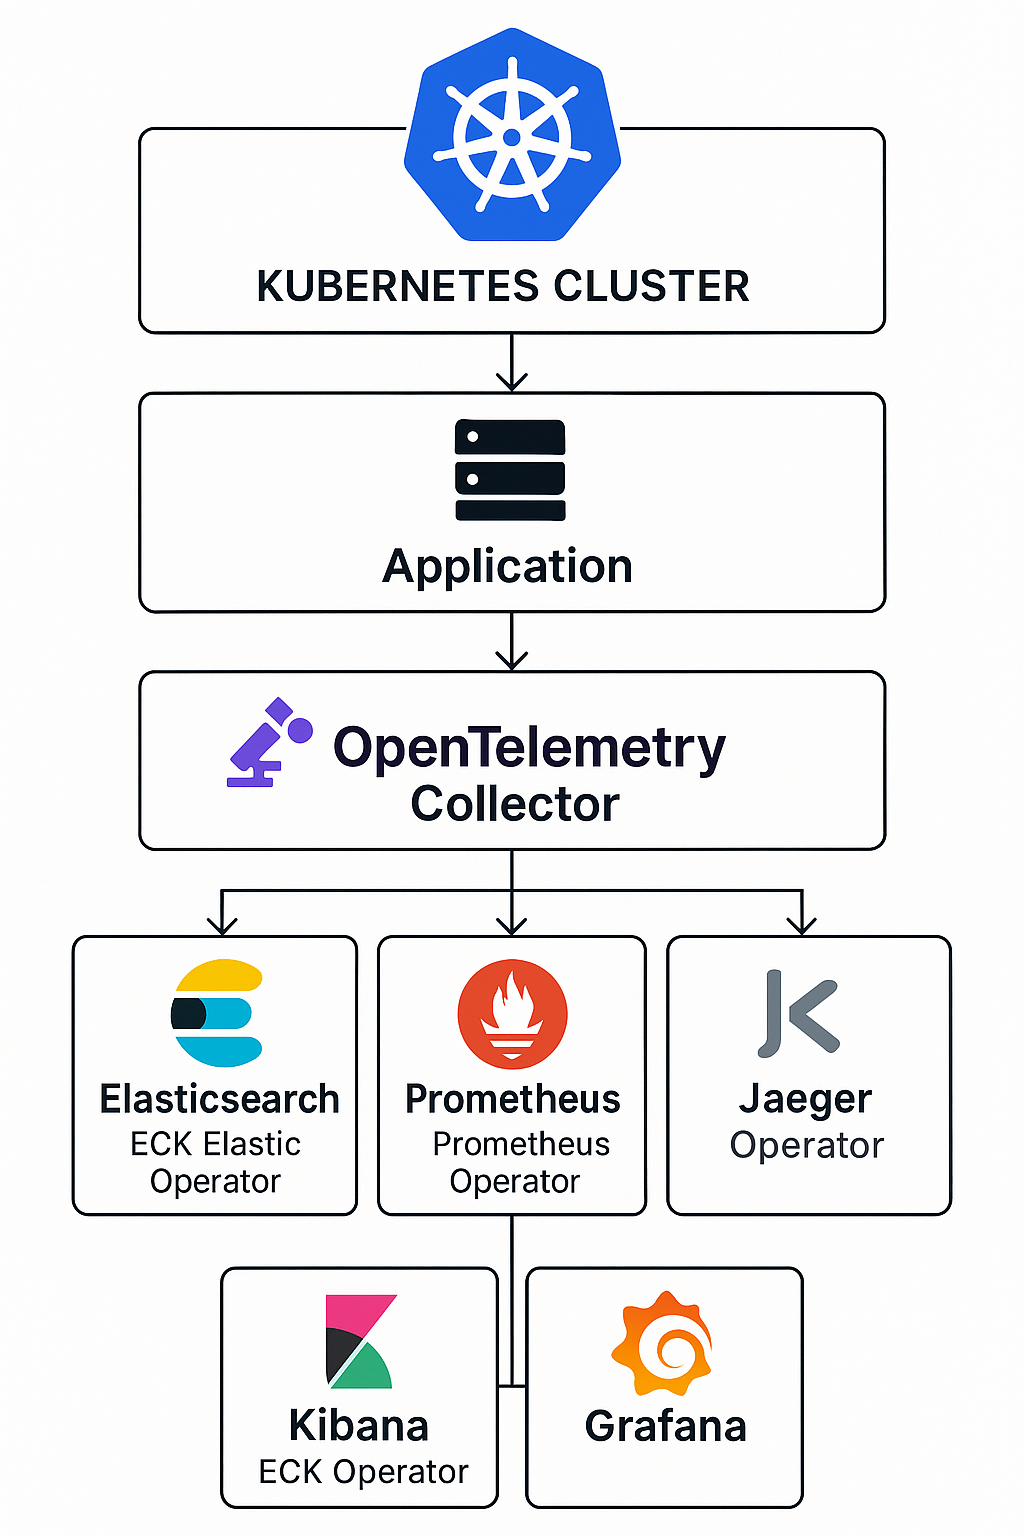
It showcases a fully integrated observability stack deployed on Kubernetes, offering end-to-end visibility across microservices. The architecture collects telemetry data, processes it, and provides actionable insights through metrics, logs, and traces.
Architecture Diagram
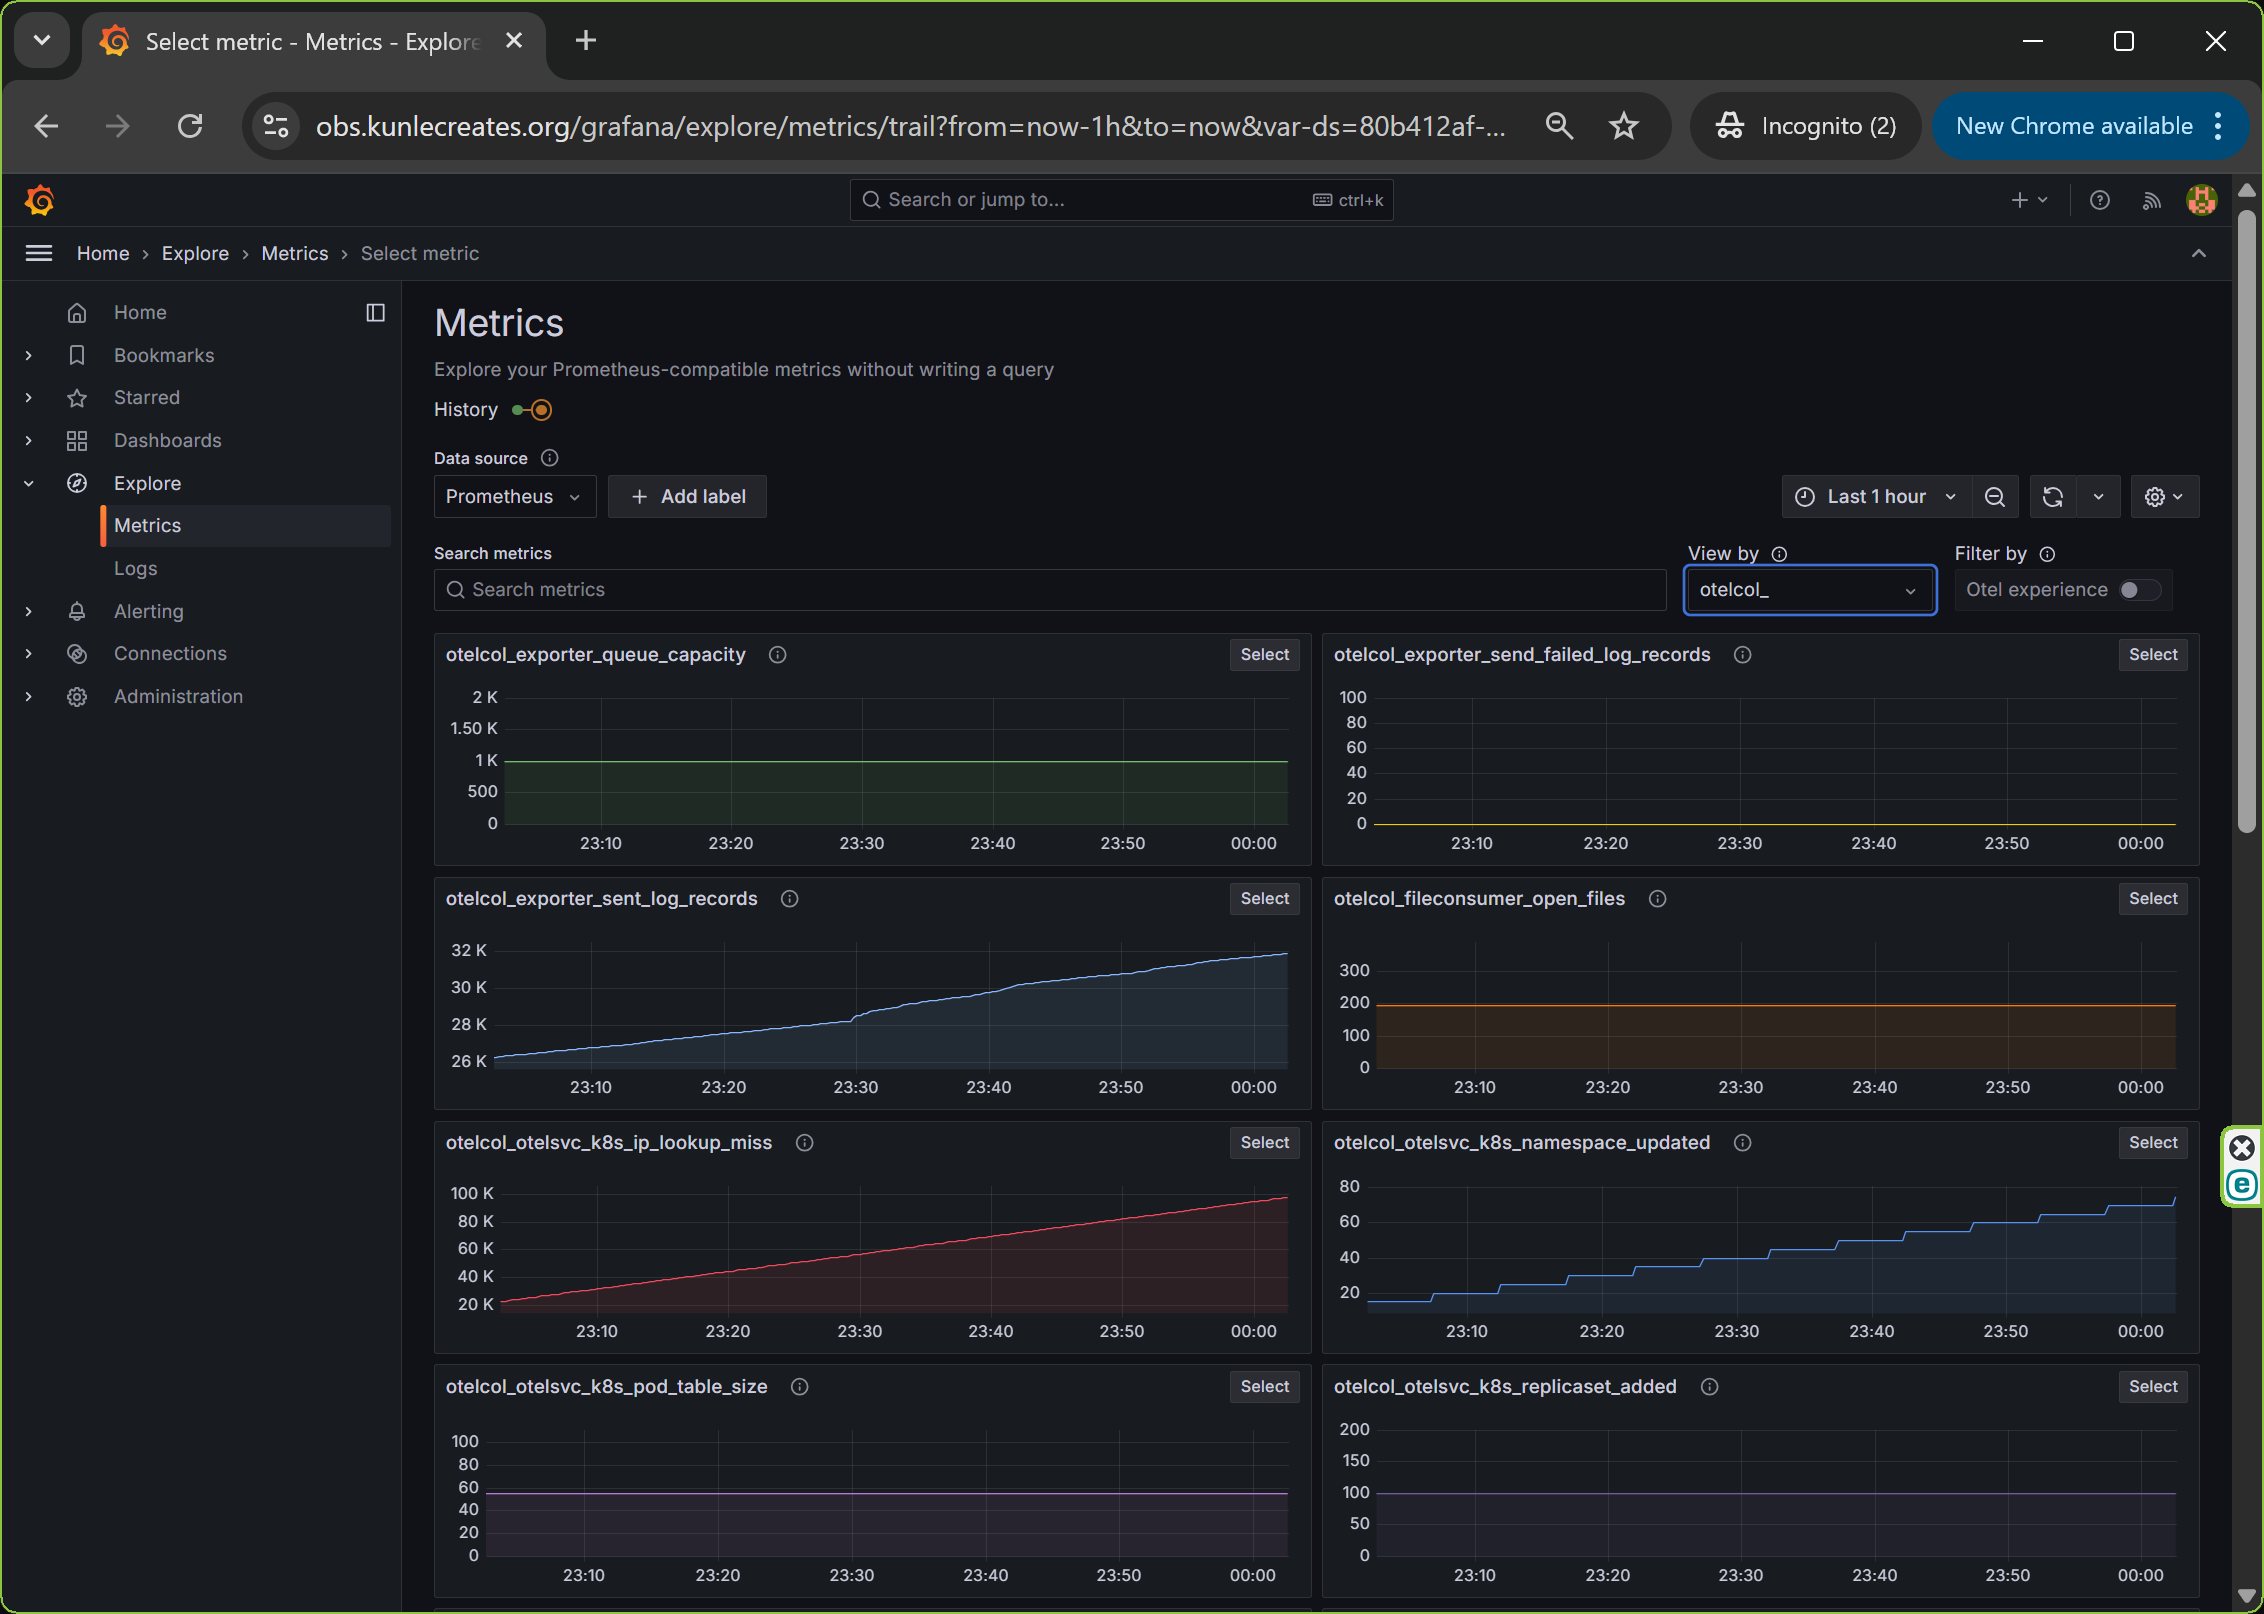
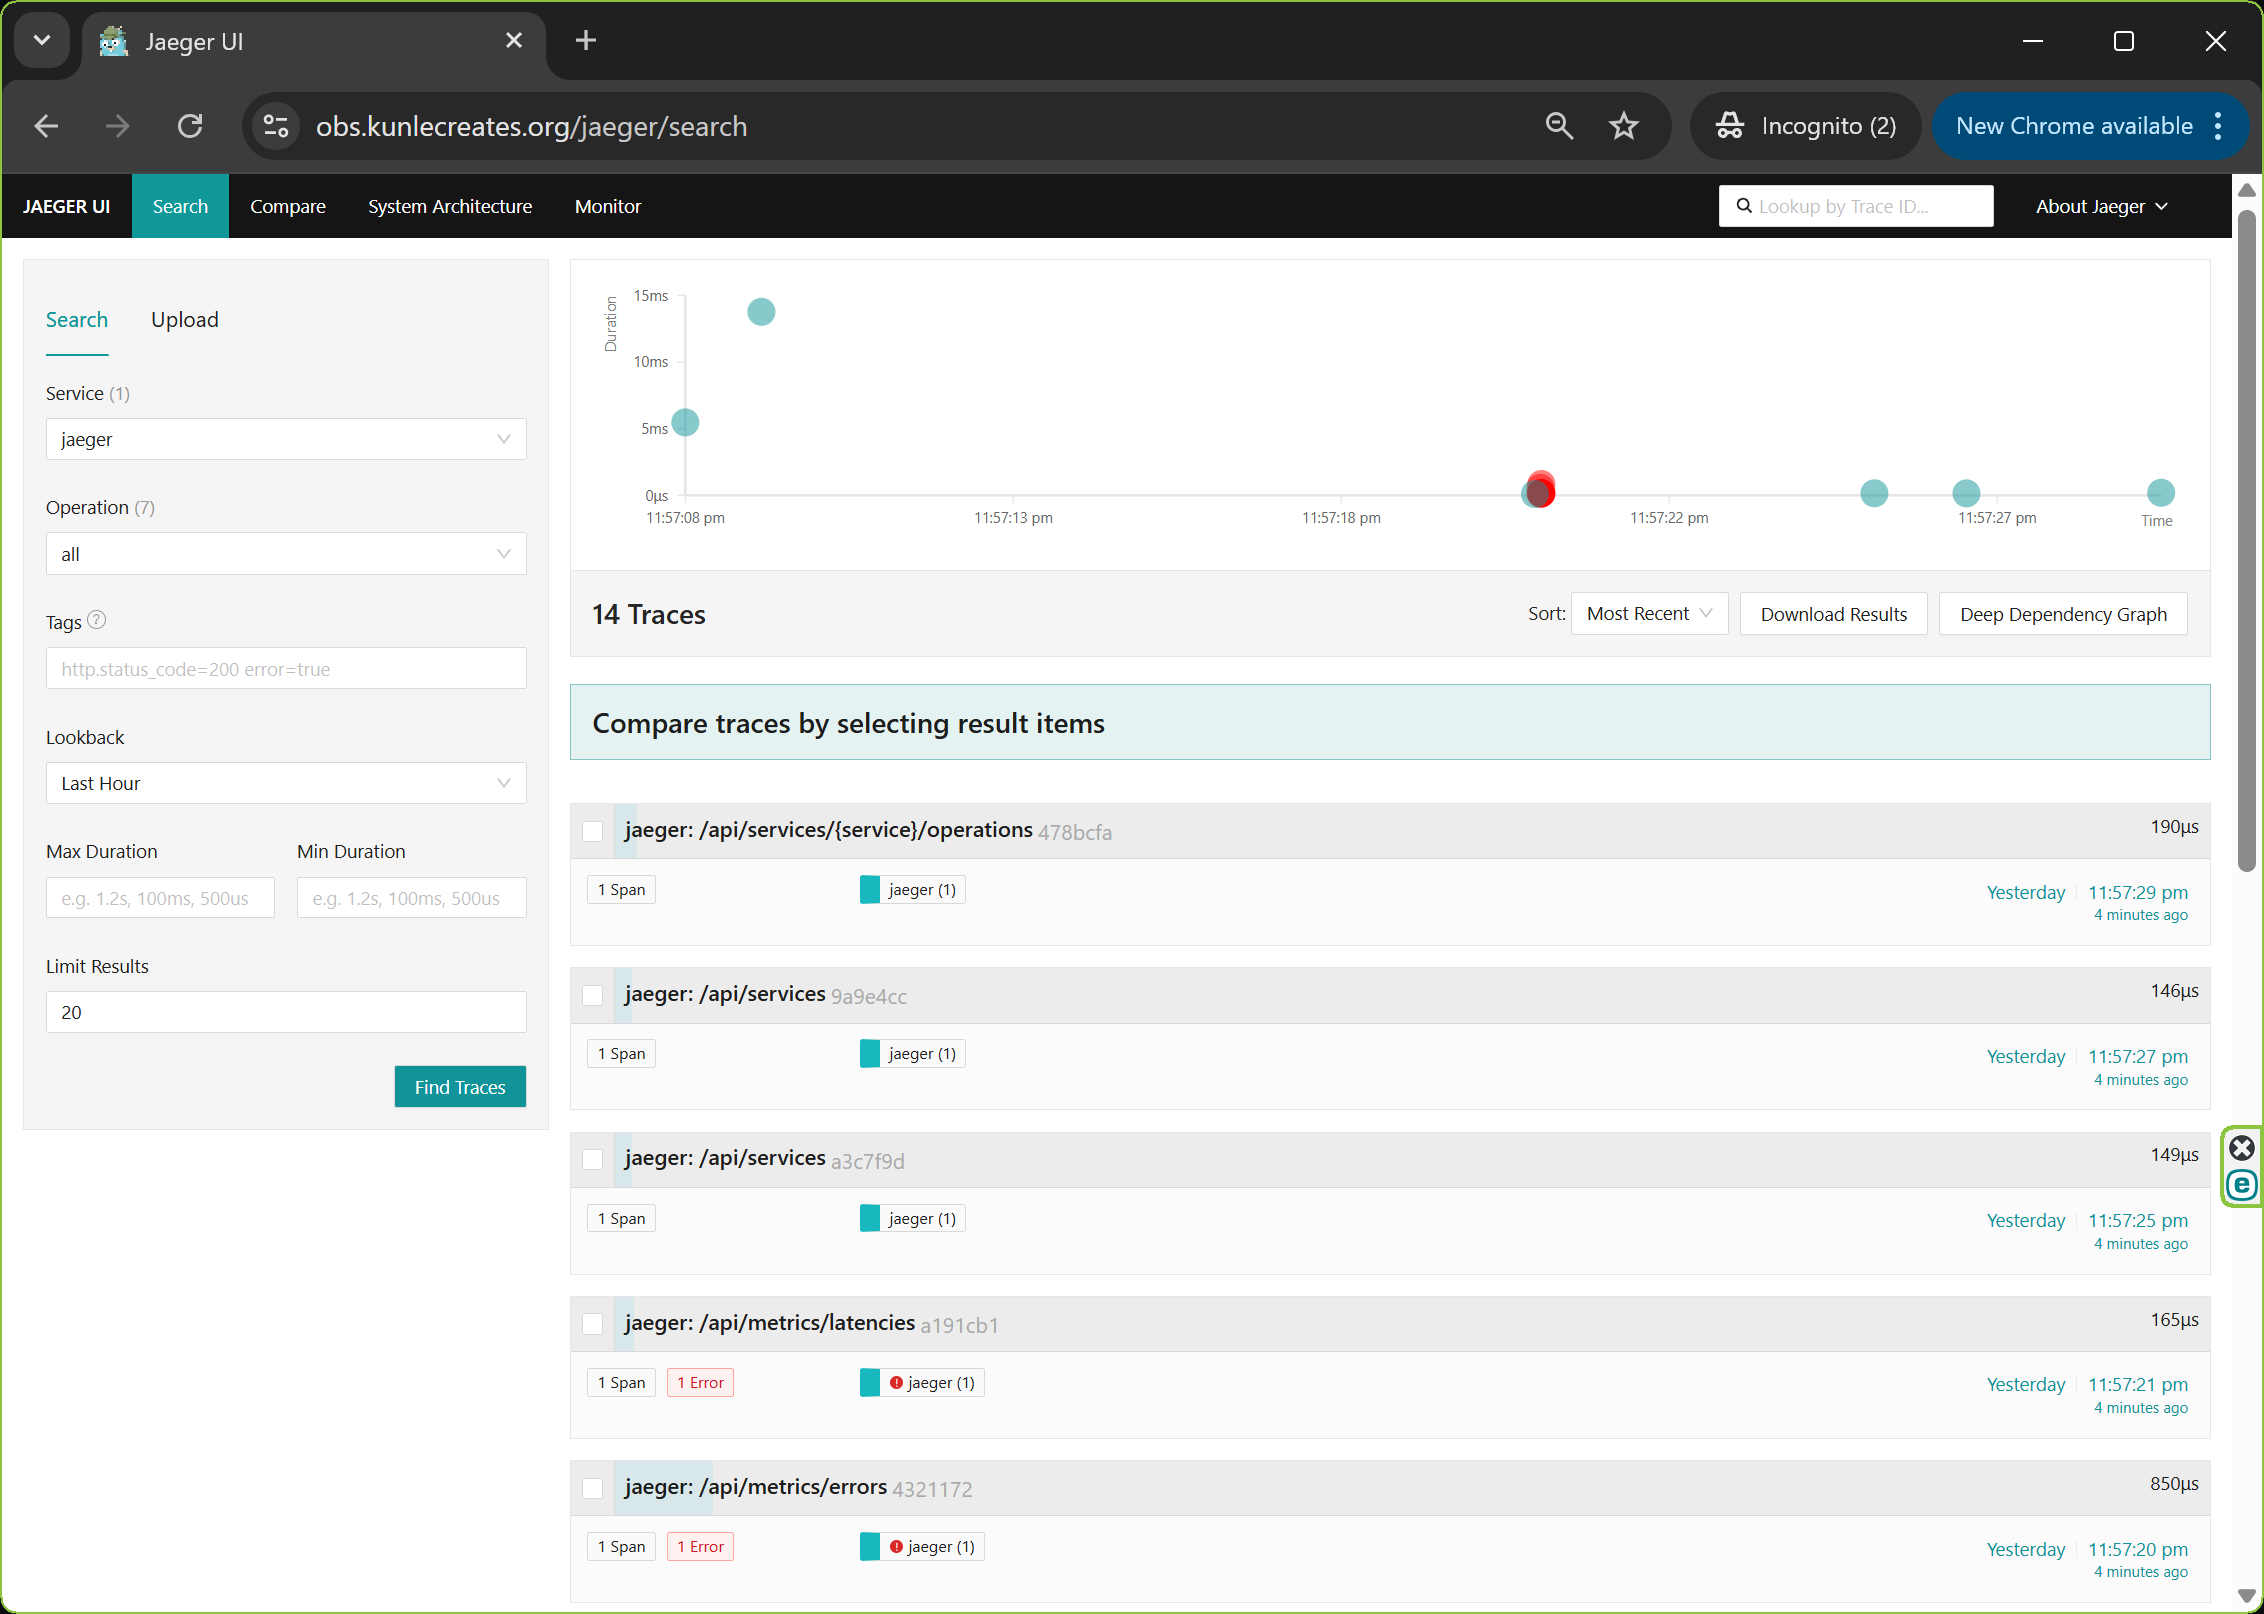
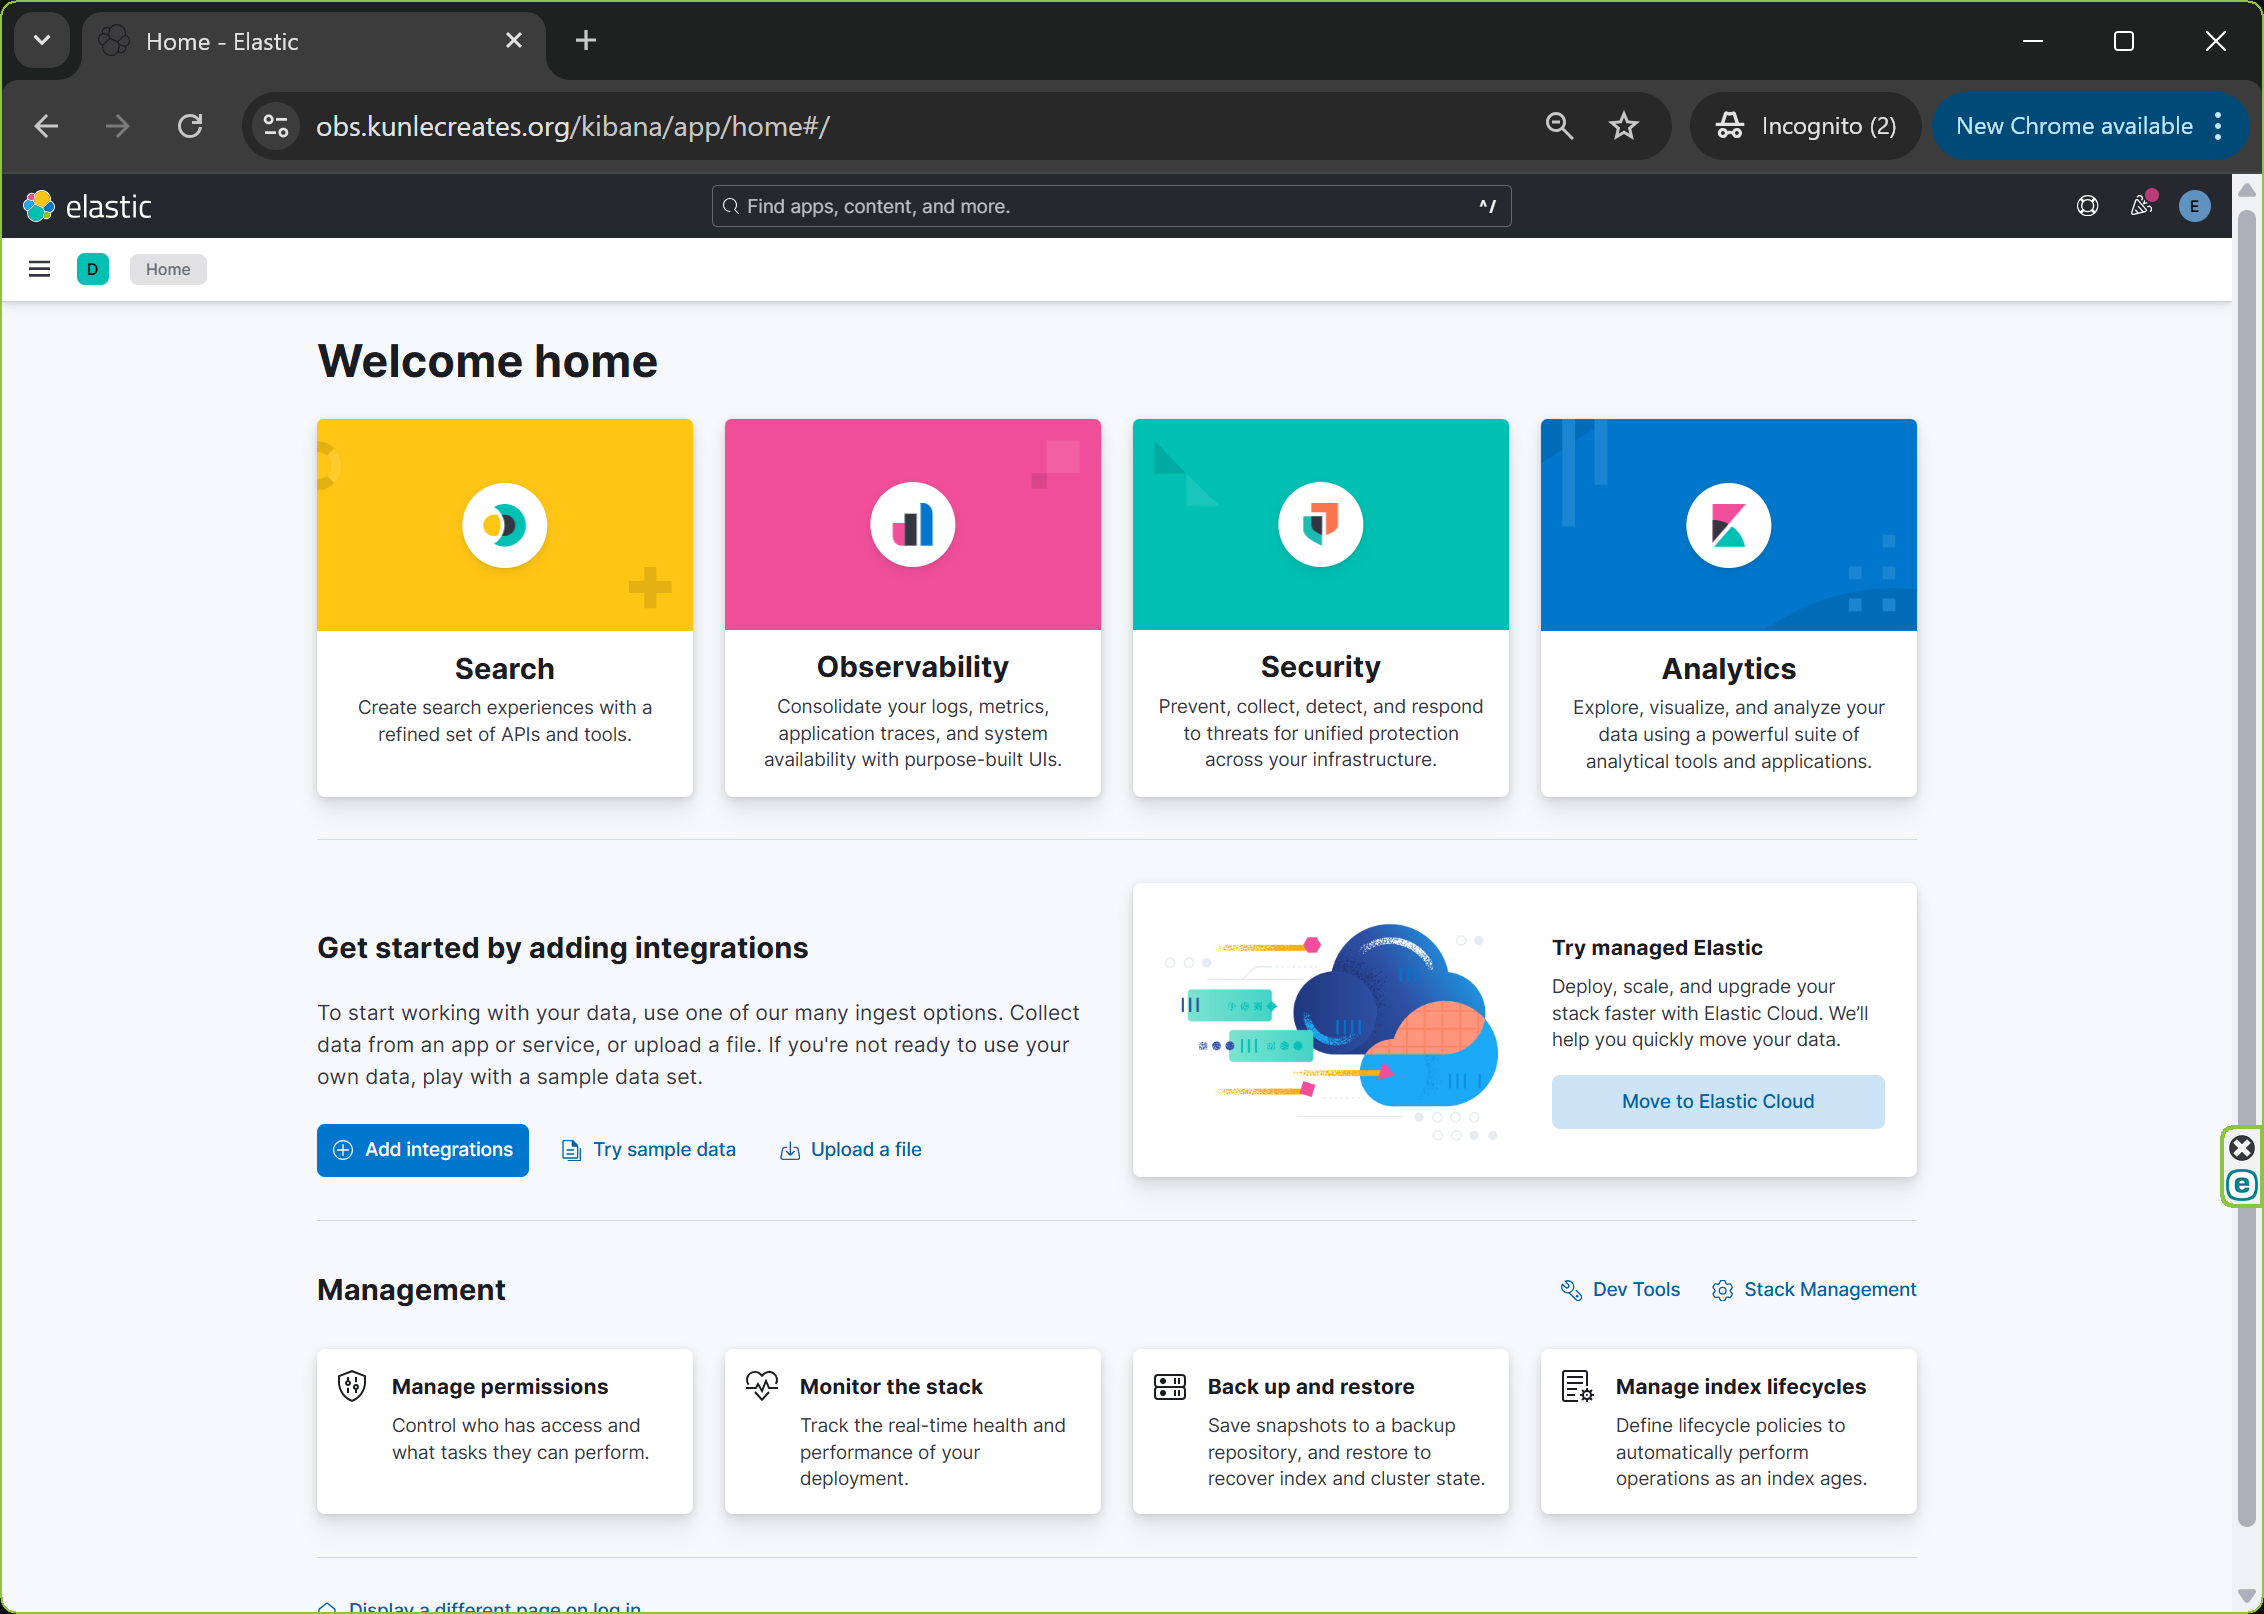
Screenshots
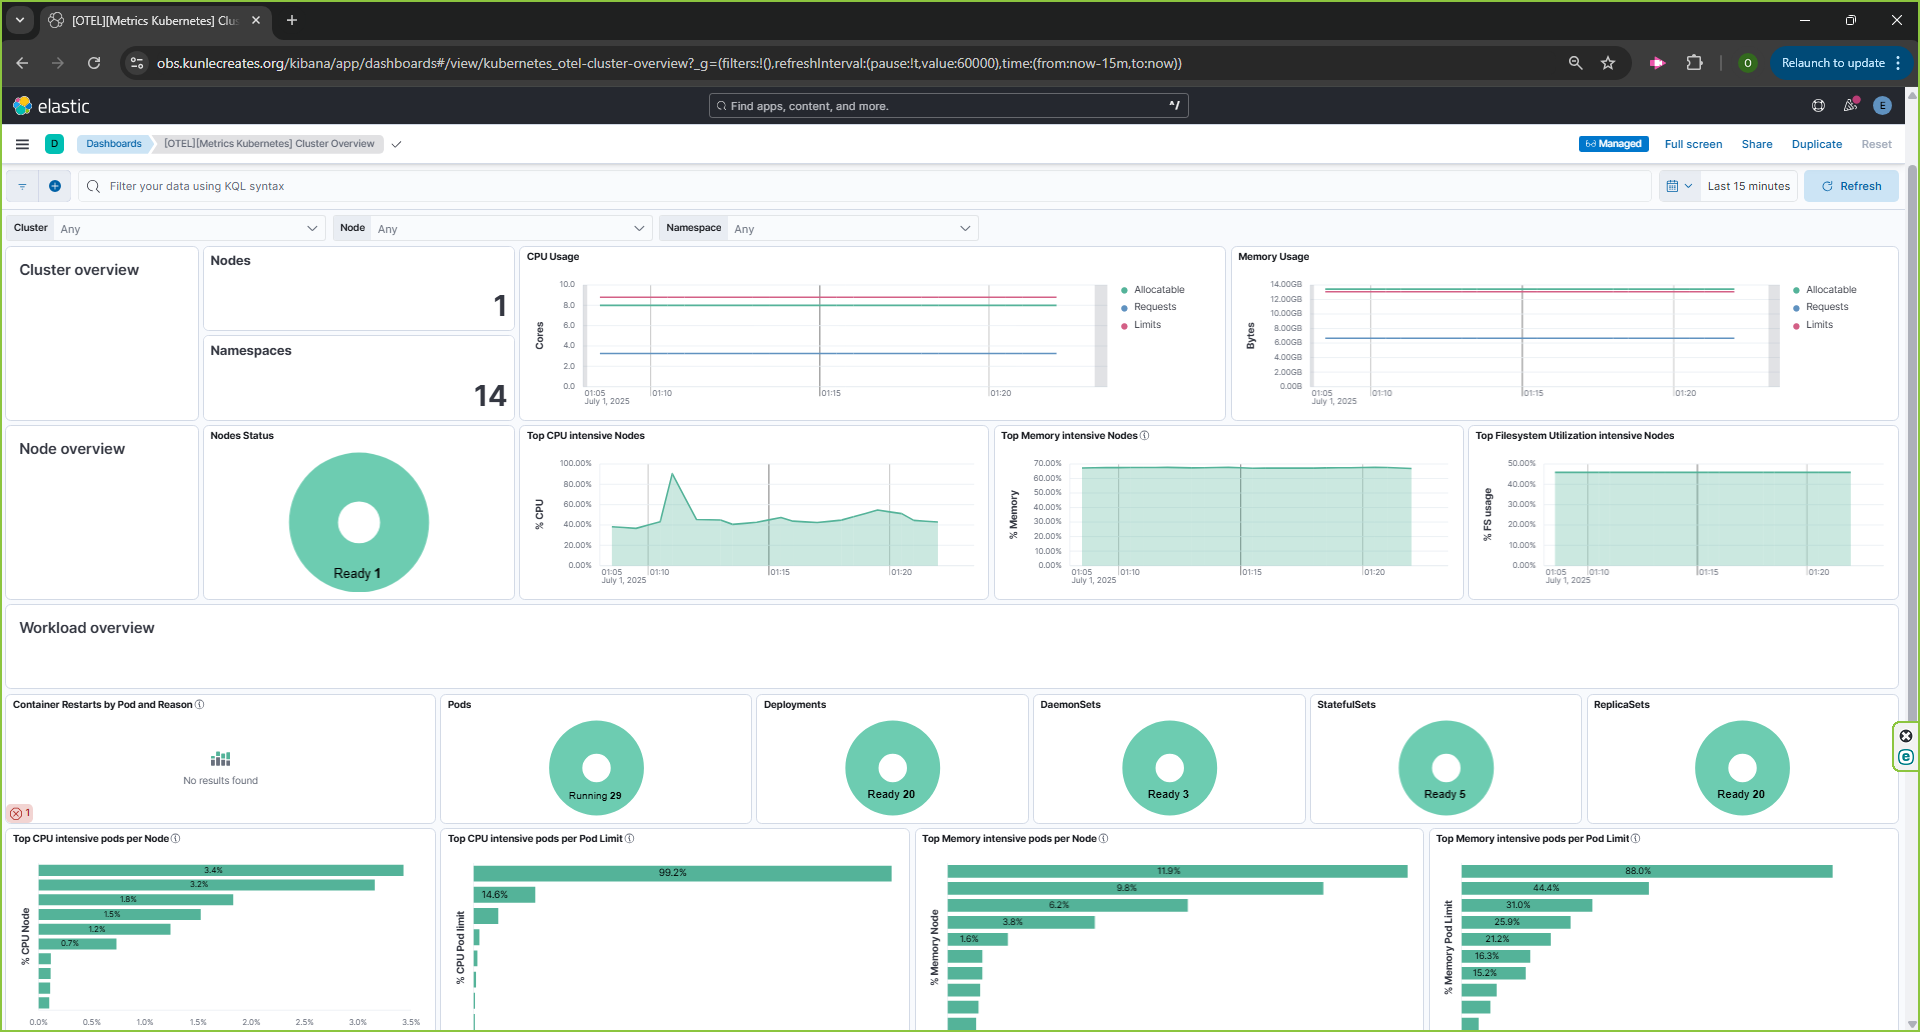
UI Walkthrough (GIF Preview)
Note: Live Walkthroughs redirect testers to an Oauth2 login page for authentication with either Google or GitHub accounts. Thanks for your understanding.
On request, the live walkthrough could be made available at this link
On request, the live walkthrough could be made available at this link
On request, the live walkthrough could be made available at this link
Tech Stack
- Kubernetes - Orchestrates microservices and observability tools
- OpenTelemetry Collector - Collects and forwards telemetry data
- Jaeger - Visualizes distributed traces
- Prometheus - Scrapes and stores time-series metrics
- Grafana - Dashboards for real-time metrics
- ECK (Elastic Cloud on Kubernetes) - Manages Elasticsearch and Kibana
- OAuth2 Proxy - Utilizes the Cloudflared Tunnel to secures access to dashboards
- Helm - Automates deployments and configuration
Deployment Workflow
- Install operators (OpenTelemetry, Jaeger, Prometheus, ECK, Grafana) using Helm charts
- Apply custom resource definitions (CRDs) for each observability component
- Deploy microservices with OpenTelemetry instrumentation
- Route data to Prometheus, Jaeger, and Elasticsearch for visualization
- Secure dashboards with Cloudflare Zero Trust; backend services are deployed behind Ingress NGINX as the API gateway
Challenges Solved
- Unified visibility across services without vendor lock-in
- Secure access to observability endpoints using OAuth2
- Automated Helm-based deployments for consistency
- Scalable telemetry collection using Operator patterns
Use Cases
- DevOps pipelines requiring performance metrics and logs
- Microservice debugging and root cause analysis
- Engineering demo environments with full traceability
Contact
The Source code is private. For a full code walkthrough, deployment scripts, or a modernization demo, please contact me directly.
Live Demos could be made available to testers after a successful request made to me.